

Project background
Self-publishing service to publish and sell print or ebooks through BNPress (Barnes & Noble). Authors lack visibility on their product performance on B&N or other publishing platforms.
Goal
An analytics dashboard to help authors gain and act on data insights, tracking customer, reading, and site data.
My role
Lead Product Designer
Visual design
UX flow mapping
User research synthesis
Team
Product Managers
Engineers
Data Science
QA
Timeline
March 2019- June 2019
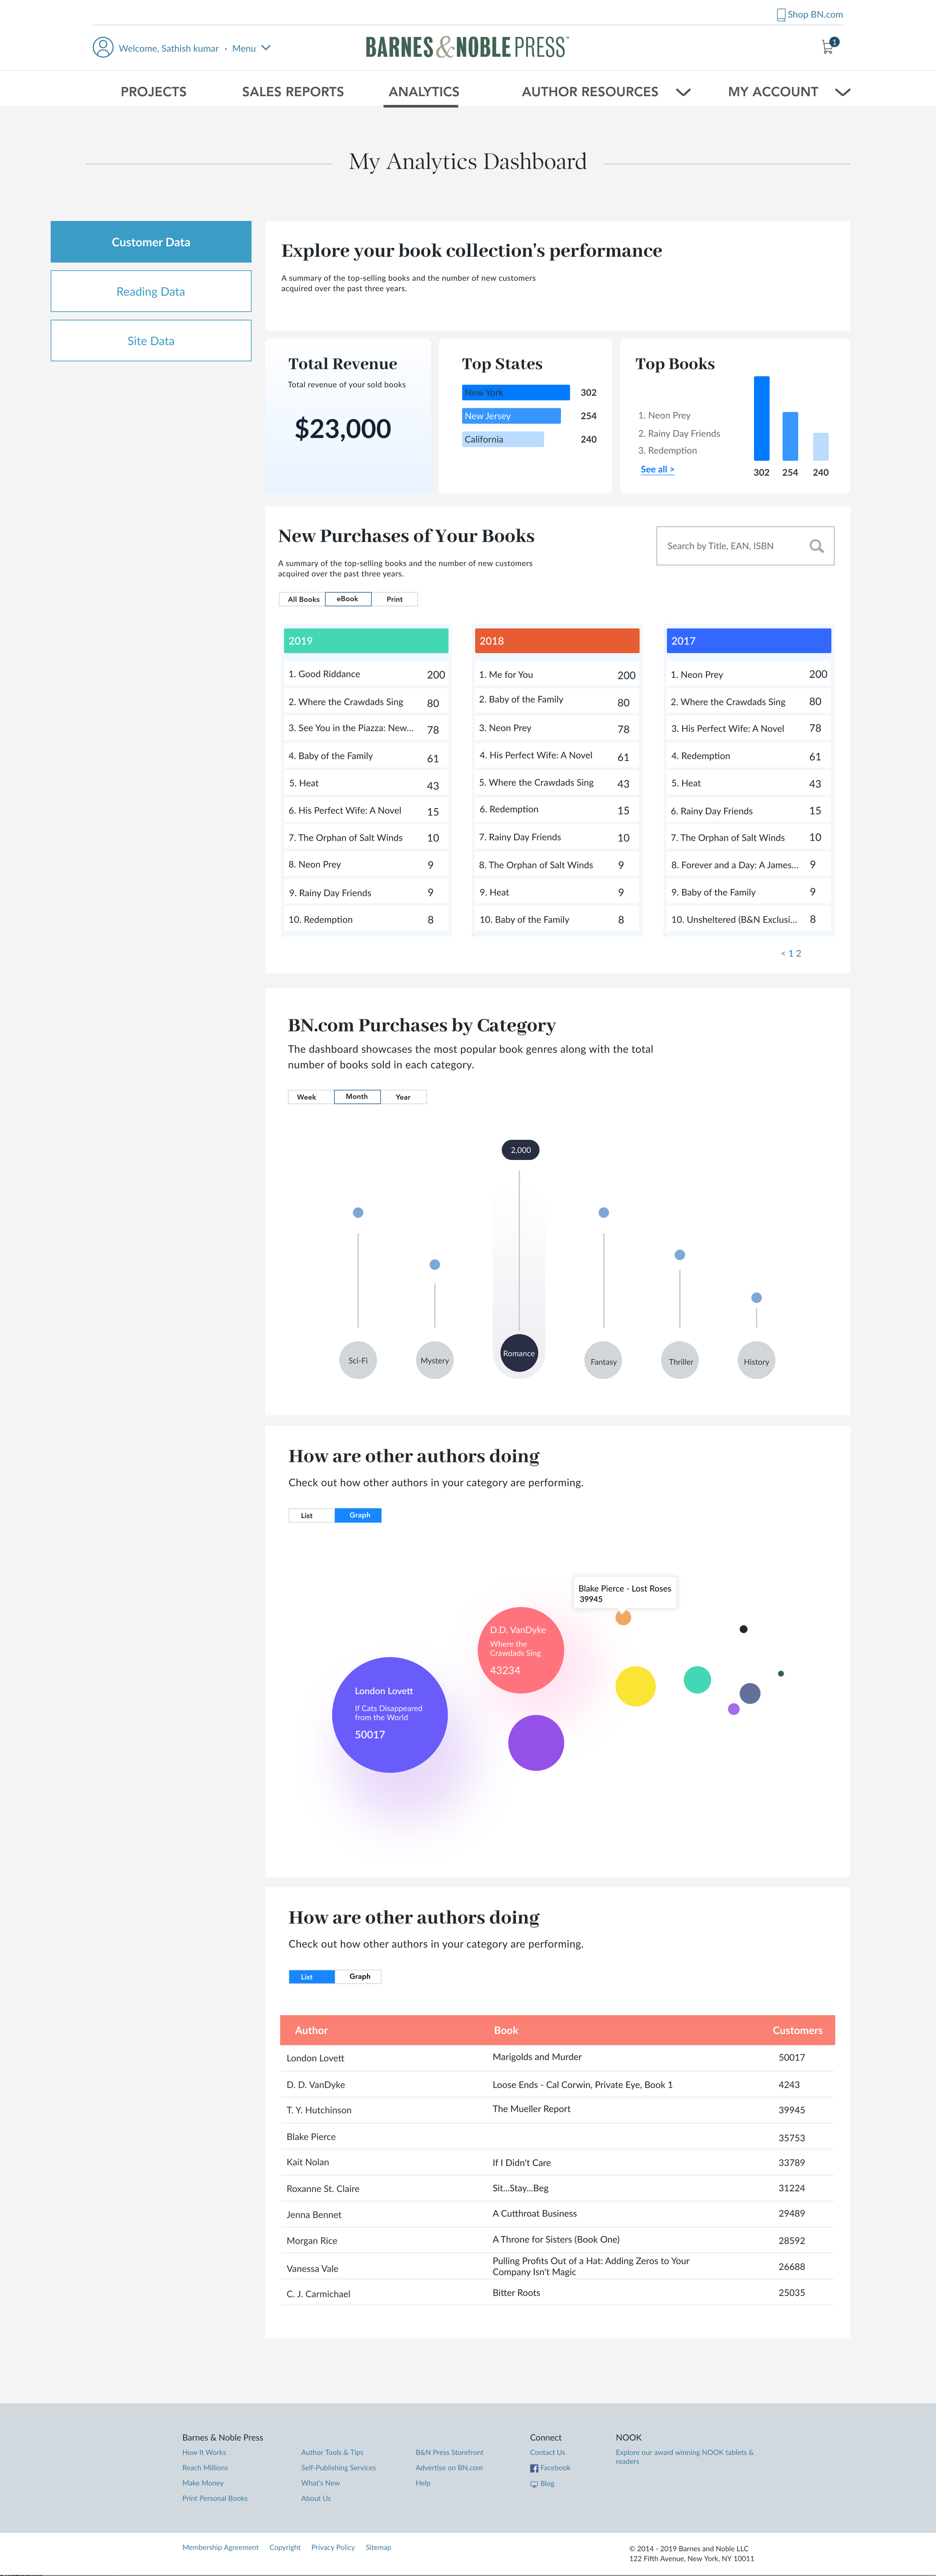
Solution
Customer data provides insights into the number of purchases per book throughout the years, popular genres, location, and other successful authors.
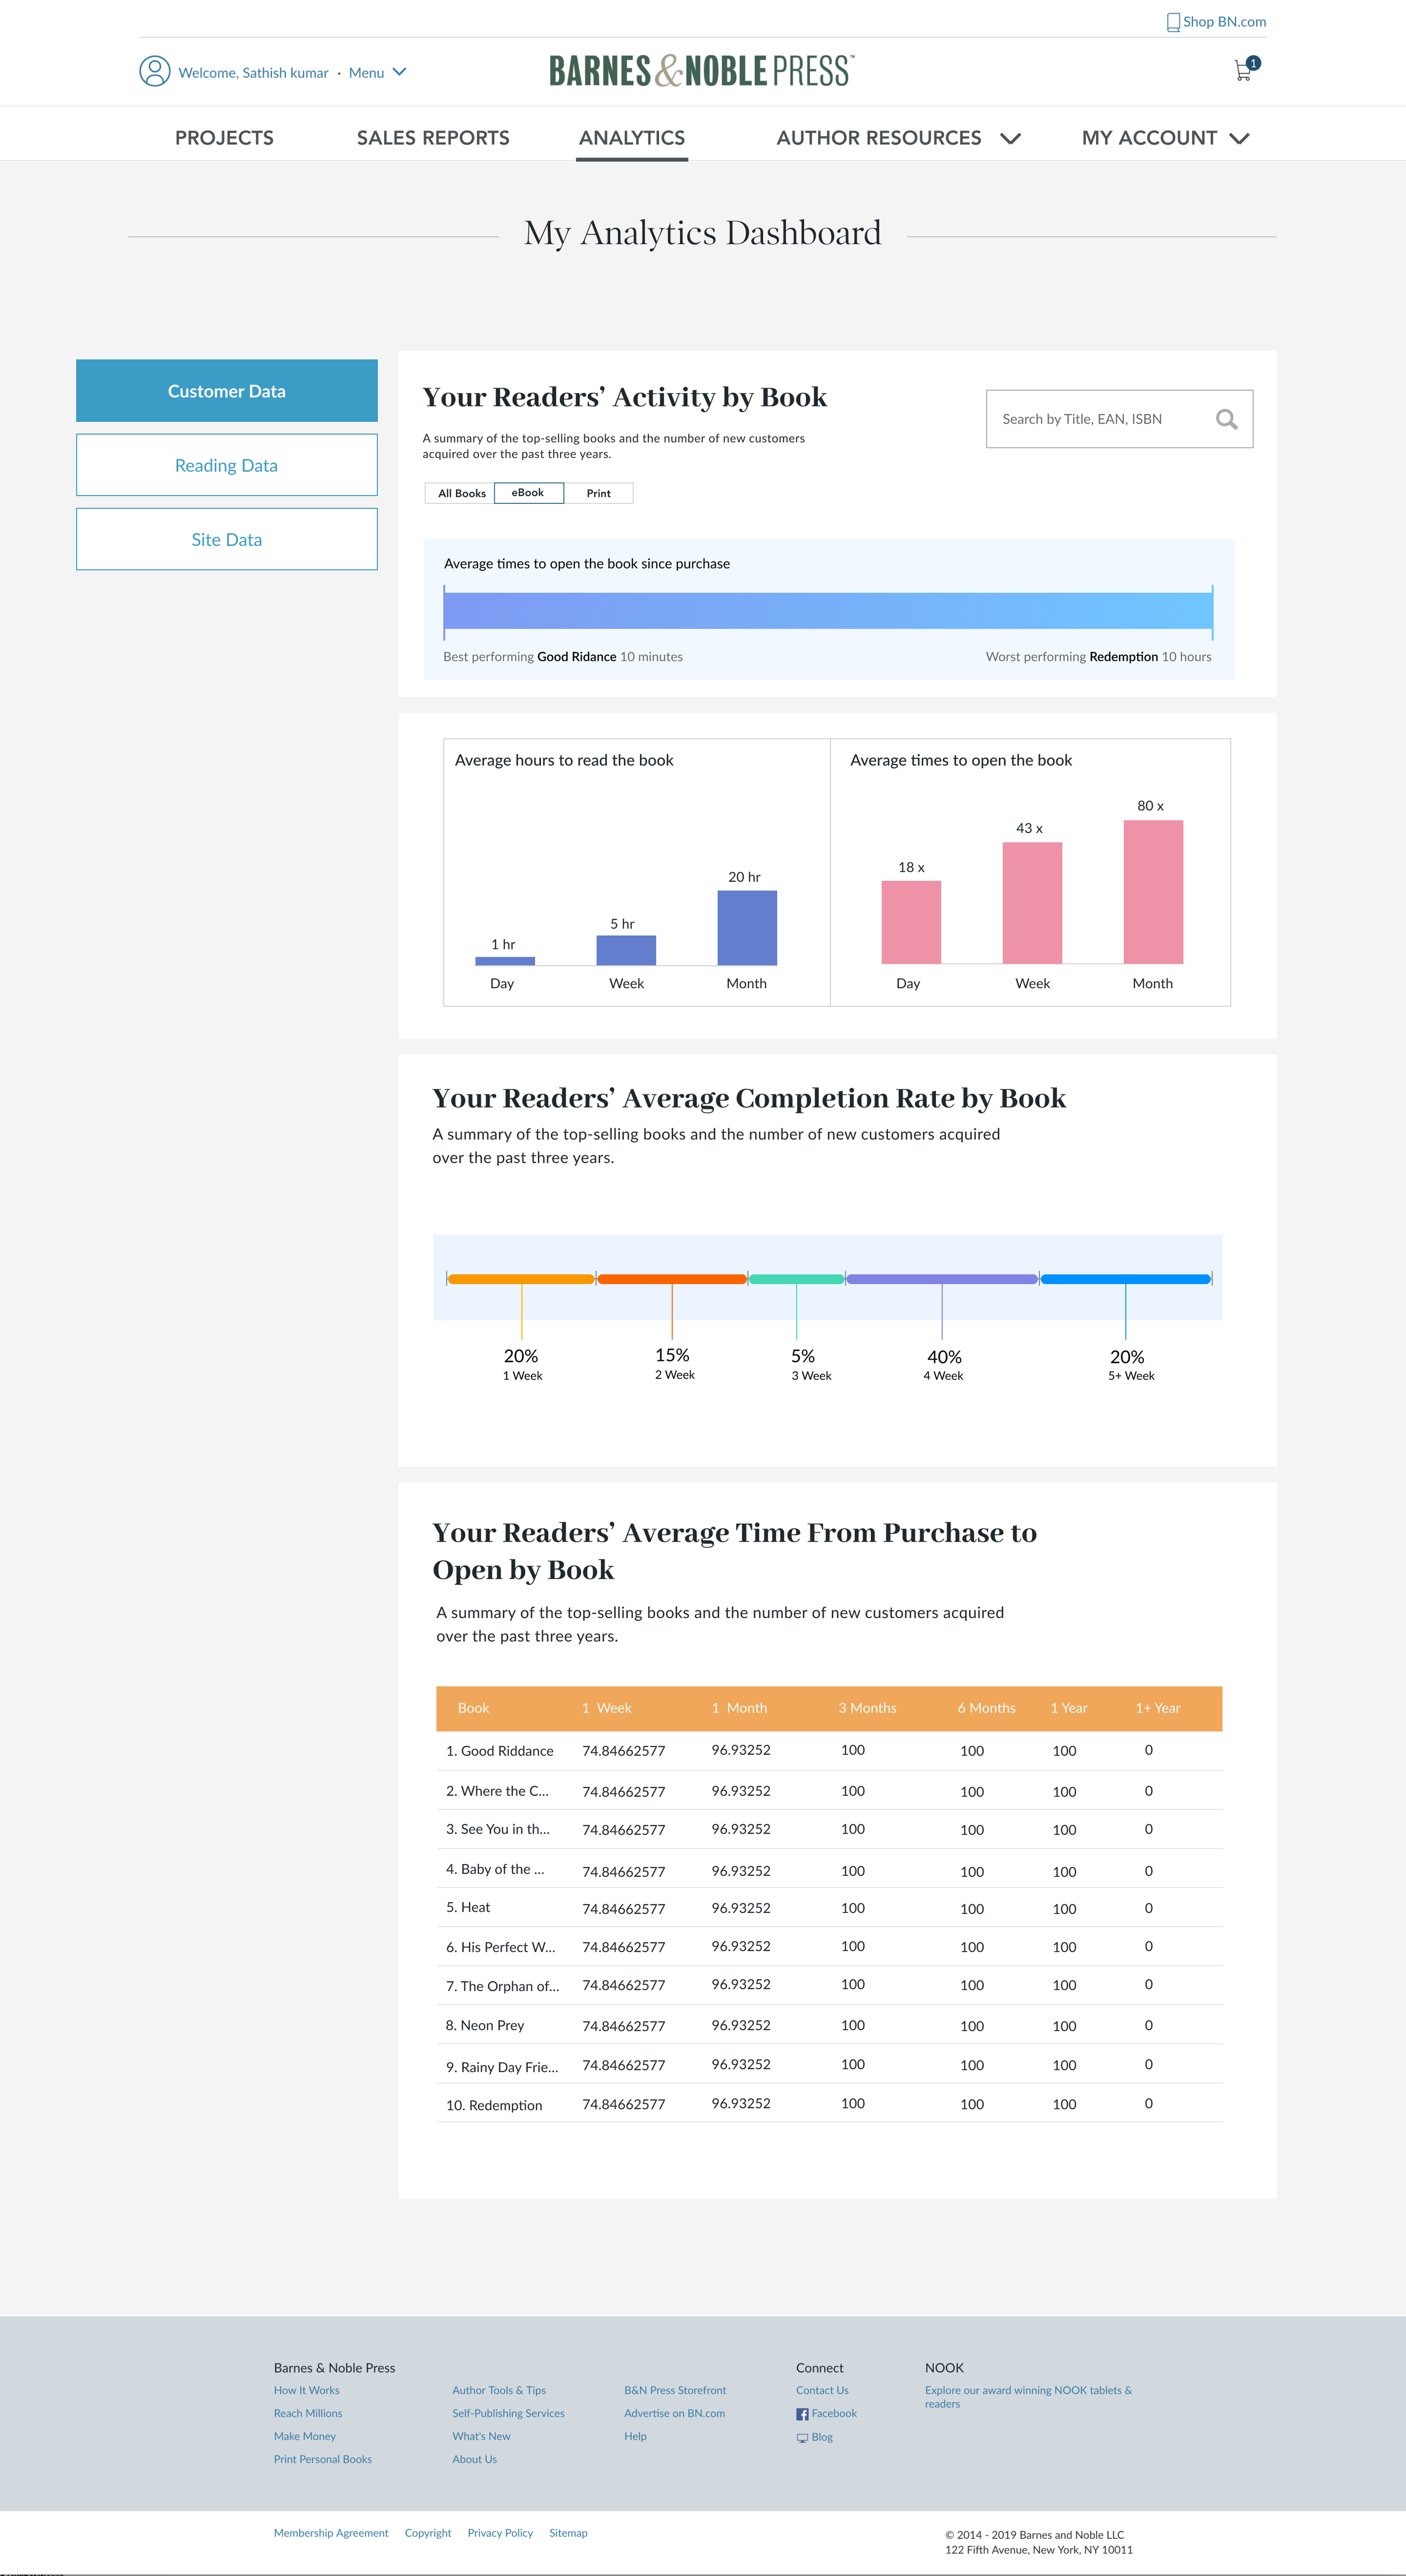
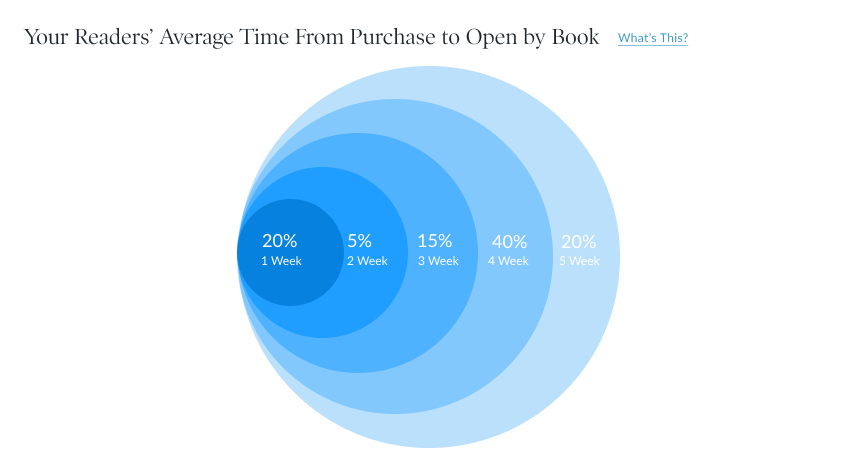
Reading data outlines the behavior of customers reading books.
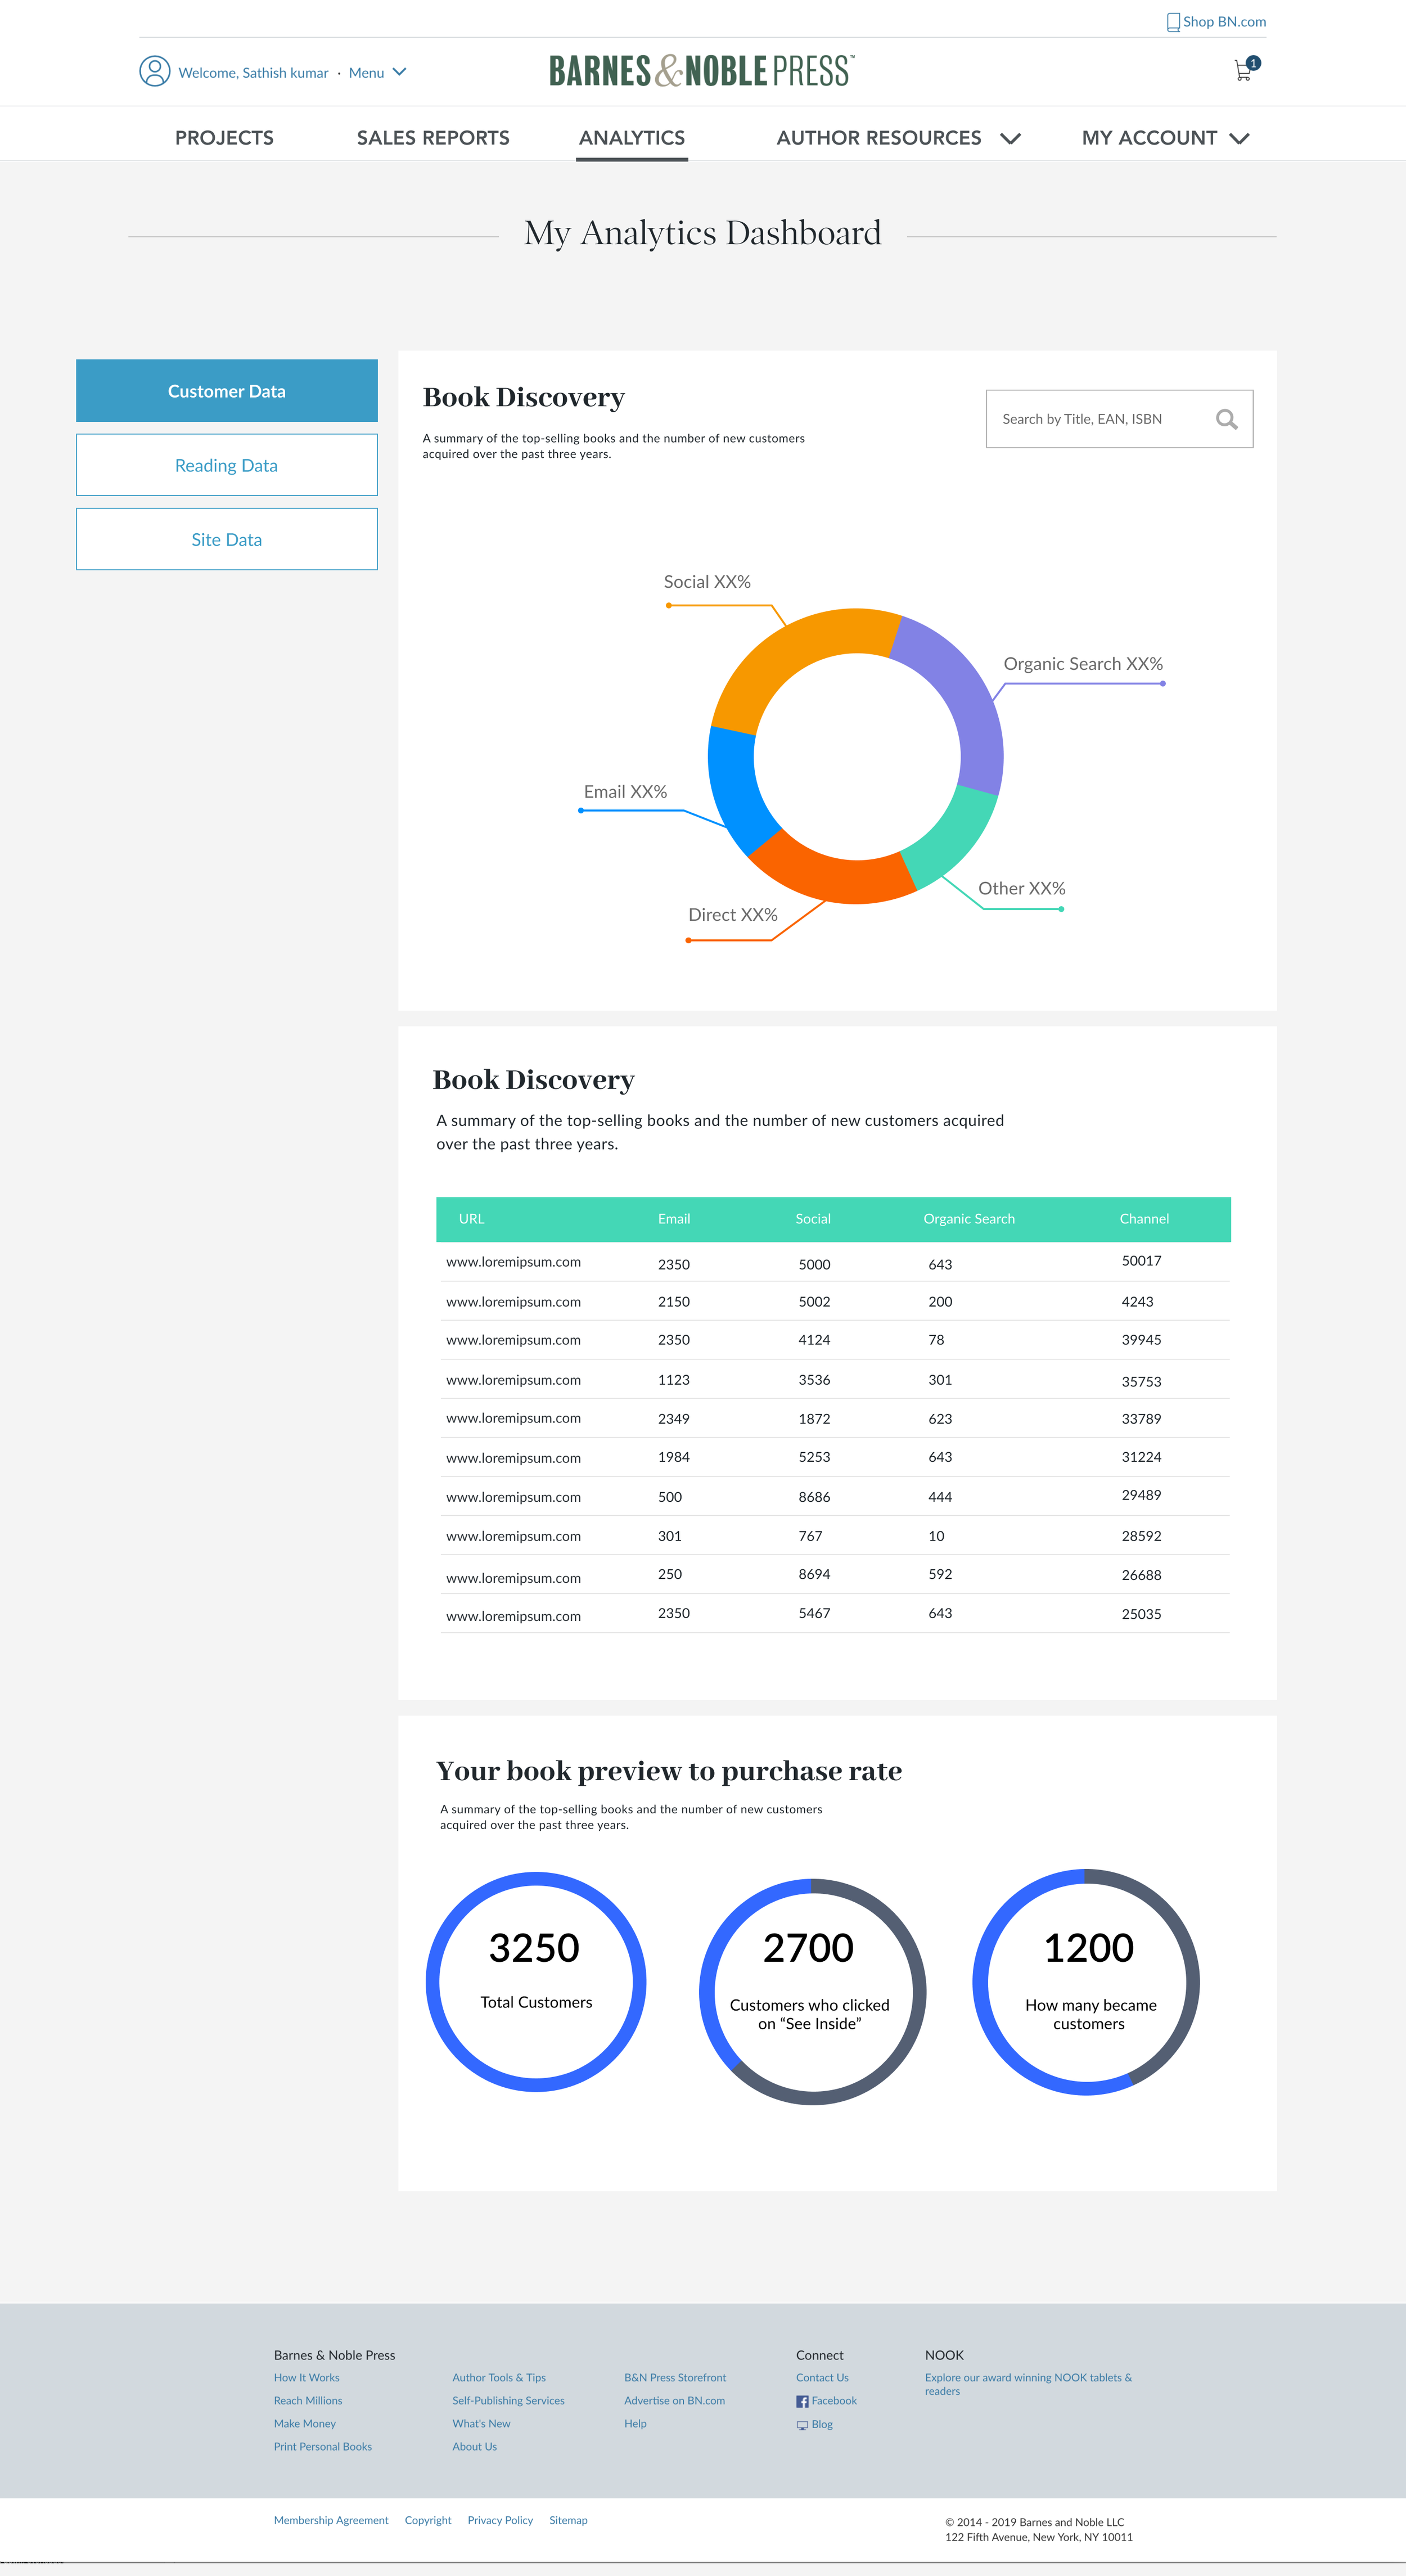
Site data shows customers' channels to get to the book product page.

How it started - discovery and research
The goal of the user research was to learn about our competitors, uncover what would make authors be interested in the product and what are some of the features they would be looking for.
“There is nothing out there that helps me track my sales. No publishing tool that I use gives me any data.” - Research participant

Findings
There is currently no product that provides them with data on their books or customers.
Authors want to see how their series or books perform over the years (are their promotions boosting sales?).
Authors want to identify their competitors or potential collaborators
How well are their books being read? Are readers completing their books? How long does it take them to read a book? How long does it take to start reading a book after purchasing it?
Early design explorations
Initially, I explored various options for charts and graphs. The challenge was to show a clear difference between sections without overwhelming users.

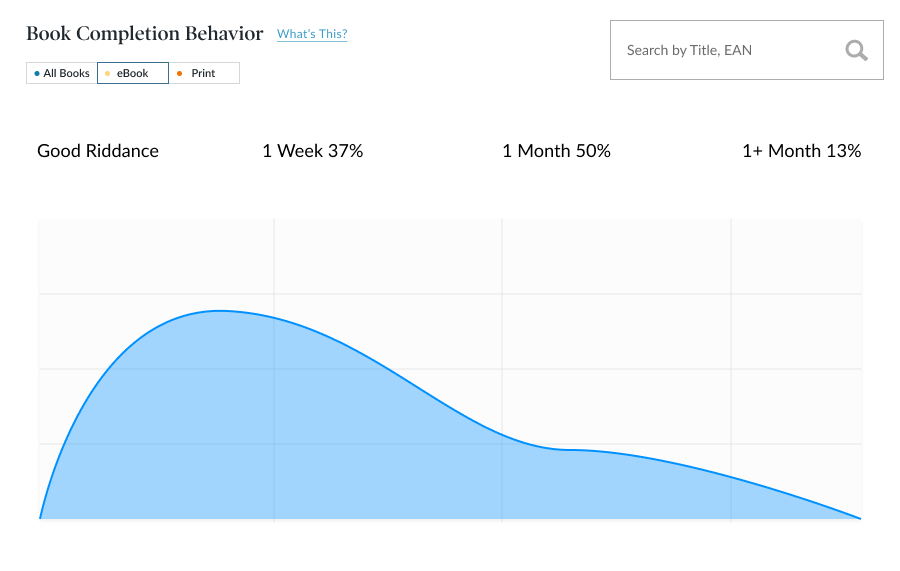

Testing
I noted issues with some graphs, particularly in the Reading Data tab and the “Other Authors” section on the Customer Data page. I created several versions, testing and adjusting to ensure the graphs were clear and valuable to authors.
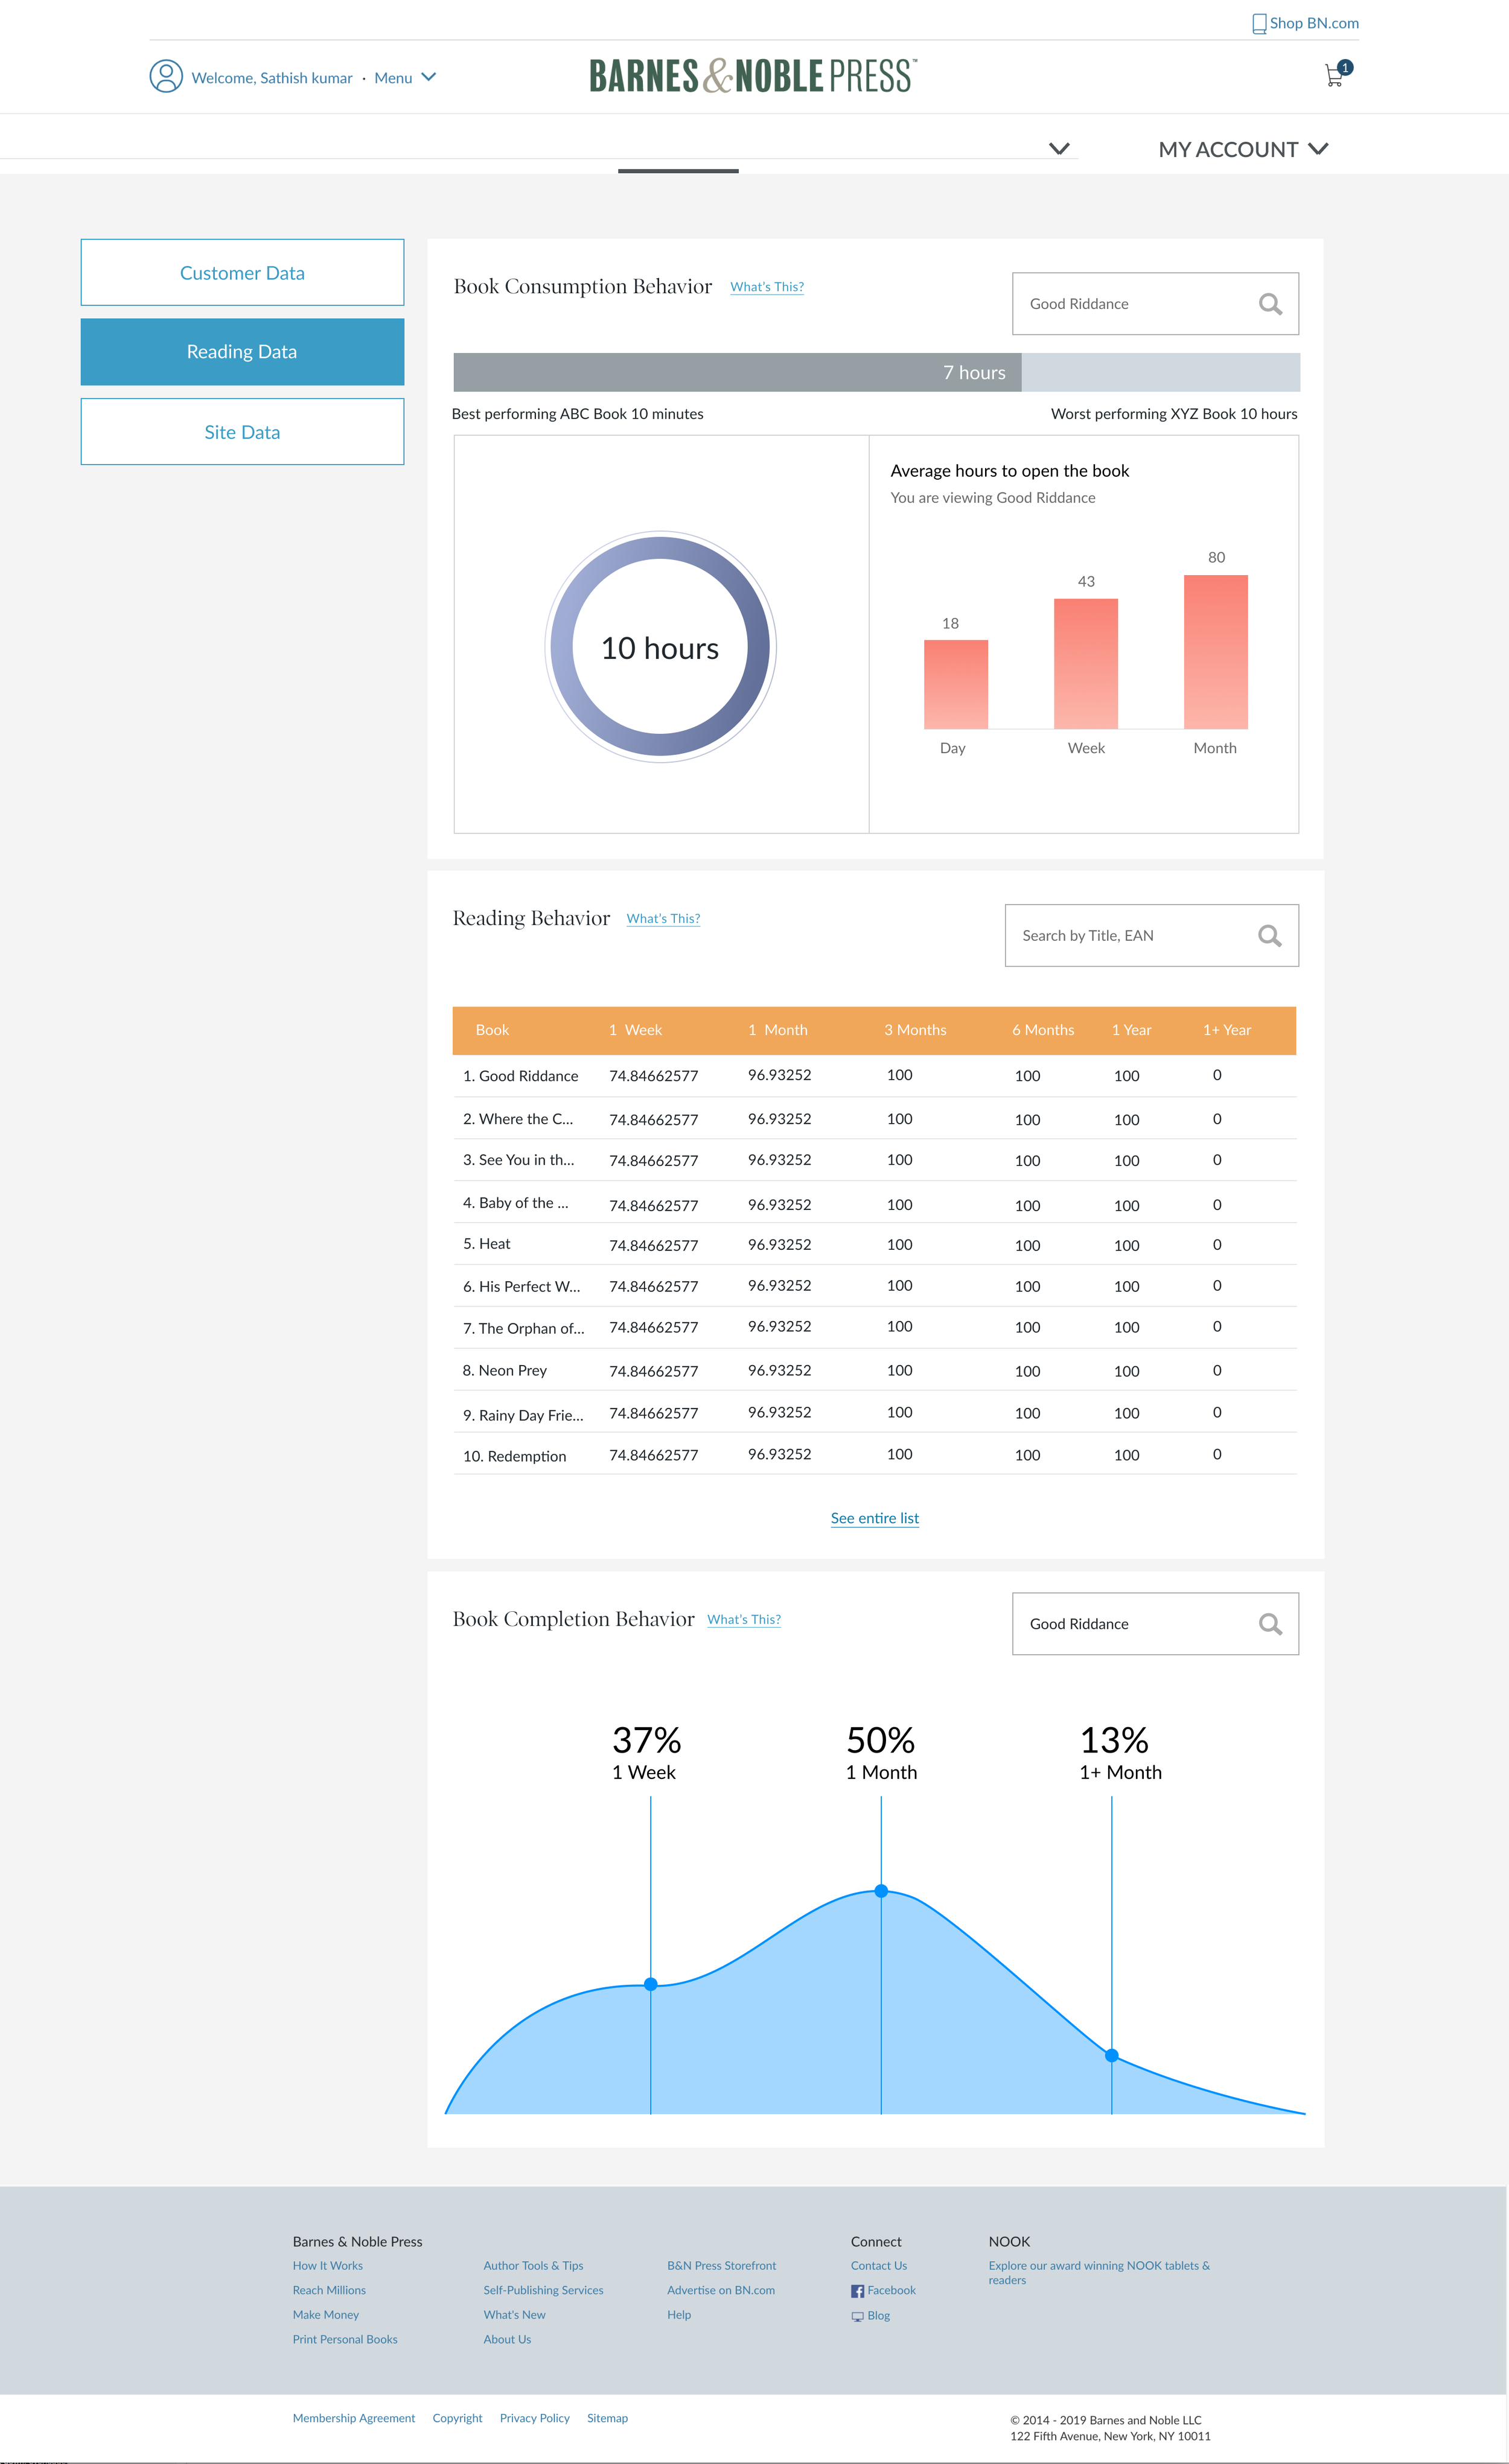
Final designs
After several iterations and discussions, this is my final MVP design. The dashboard has three categories: customer, reading, and site data.